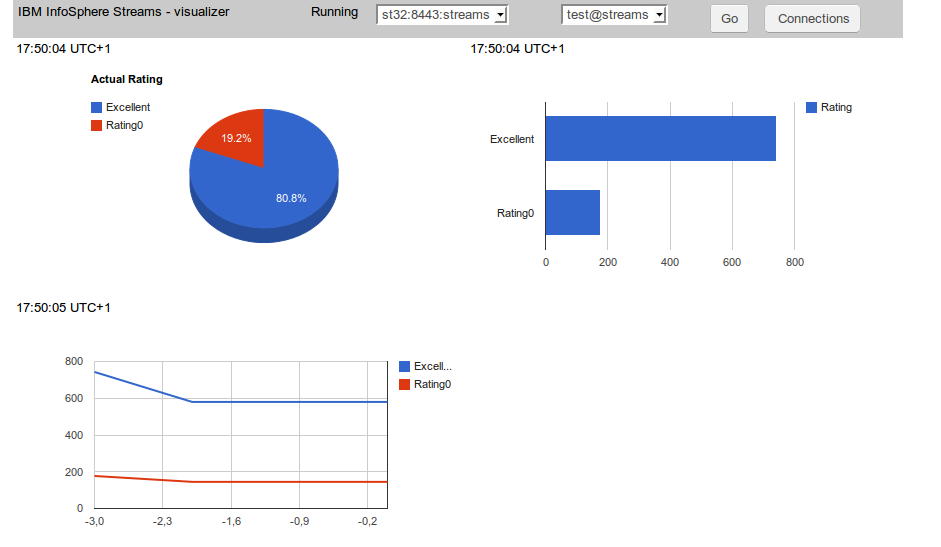
One thing is to get access to IBM InfoSphere Streams via REST API but another thing is to make use of it. So I created a simple GWT application which connects to the Streams instance and monitors execution of SPL project (by reading operator custom metric) and displays the result as a graphic charts.
Source code for GWT application is available here. As a 'chart engine' Google Charts is used with GWT wrapping library.
Streams SPL code
It is a very simple SPL application. Source code is available here. Just generates randomly number 0 - 4 and counts all 0 as 'rating0' and all other numbers as 'excellent'.
Connections handling
Every connection is defined by host and port and authentication credentials (user and password). So a special module has been created for defining and storing a list of connections.
List is stored as a browser cookie entry. To keep connection 'database' separated an interface has been created.
/**
 *
 * @author sbartkowski
 * Container for database containing connections data
 */

public interface IDatabase {


        enum OP {
                ADD, REMOVE, CHANGE
        };

        // List of connections
        List getList();

        // Add, remove or change connection
        void databaseOp(OP op, ConnectionData data);

        // Test if connection exists (by host, port and user)
        boolean connectionExists(ConnectionData data);

        // Creates connection identifier host:port:user
        String toS(ConnectionData data);

        // Find connection by identifier
        ConnectionData findS(String s);

}
'Cookie' implementation is available here. This way it is possible to change the storing mechanism without affecting the rest of the application.Because one host can supervise more then one instance also combo box with the list of instances is created.
Localization
All strings used in the user interface are defined as com.google.gwt.i18n.client.Constants resource. For the time being only English version is created but no problem to add another locale resource.
Charts
Google Charts is used for this purpose together with GWT visualization interface. Three charts types are used: PieChart, BarChart and LineChart. A source code preparing and refreshing this charts is available here.
Access to Streams REST API
Because of the Same Origin Policy restriction it is not possible to make REST API call directly from GWT client application. So the call is made from the server side (Java) code and send to the client via RPC. The server side code is available here. The JSON string is sent unmodified and then decoded at the client side using GWT JSON package.
Conclusion
After resolving some technical issues the REST API access to IBM InfoSphere Streams seems to be quite easy and straightforward. The combination of GWT, Google Charts and REST API is very powerful and this basic application can serve as a basis for developing more complex solution.


Brak komentarzy:
Prześlij komentarz